Task & Objectives
The assignment for this exploration was to investigate climate (i.e., precipitation and temperature) trends for somewhere you want to live. I chose the Upper Peninsula of Michigan.
Tools & Workflow
- Data were downloaded from PRISM.
- Figure production was completed in RStudio with several packages:
ggplotandtidyverse.
Final Results
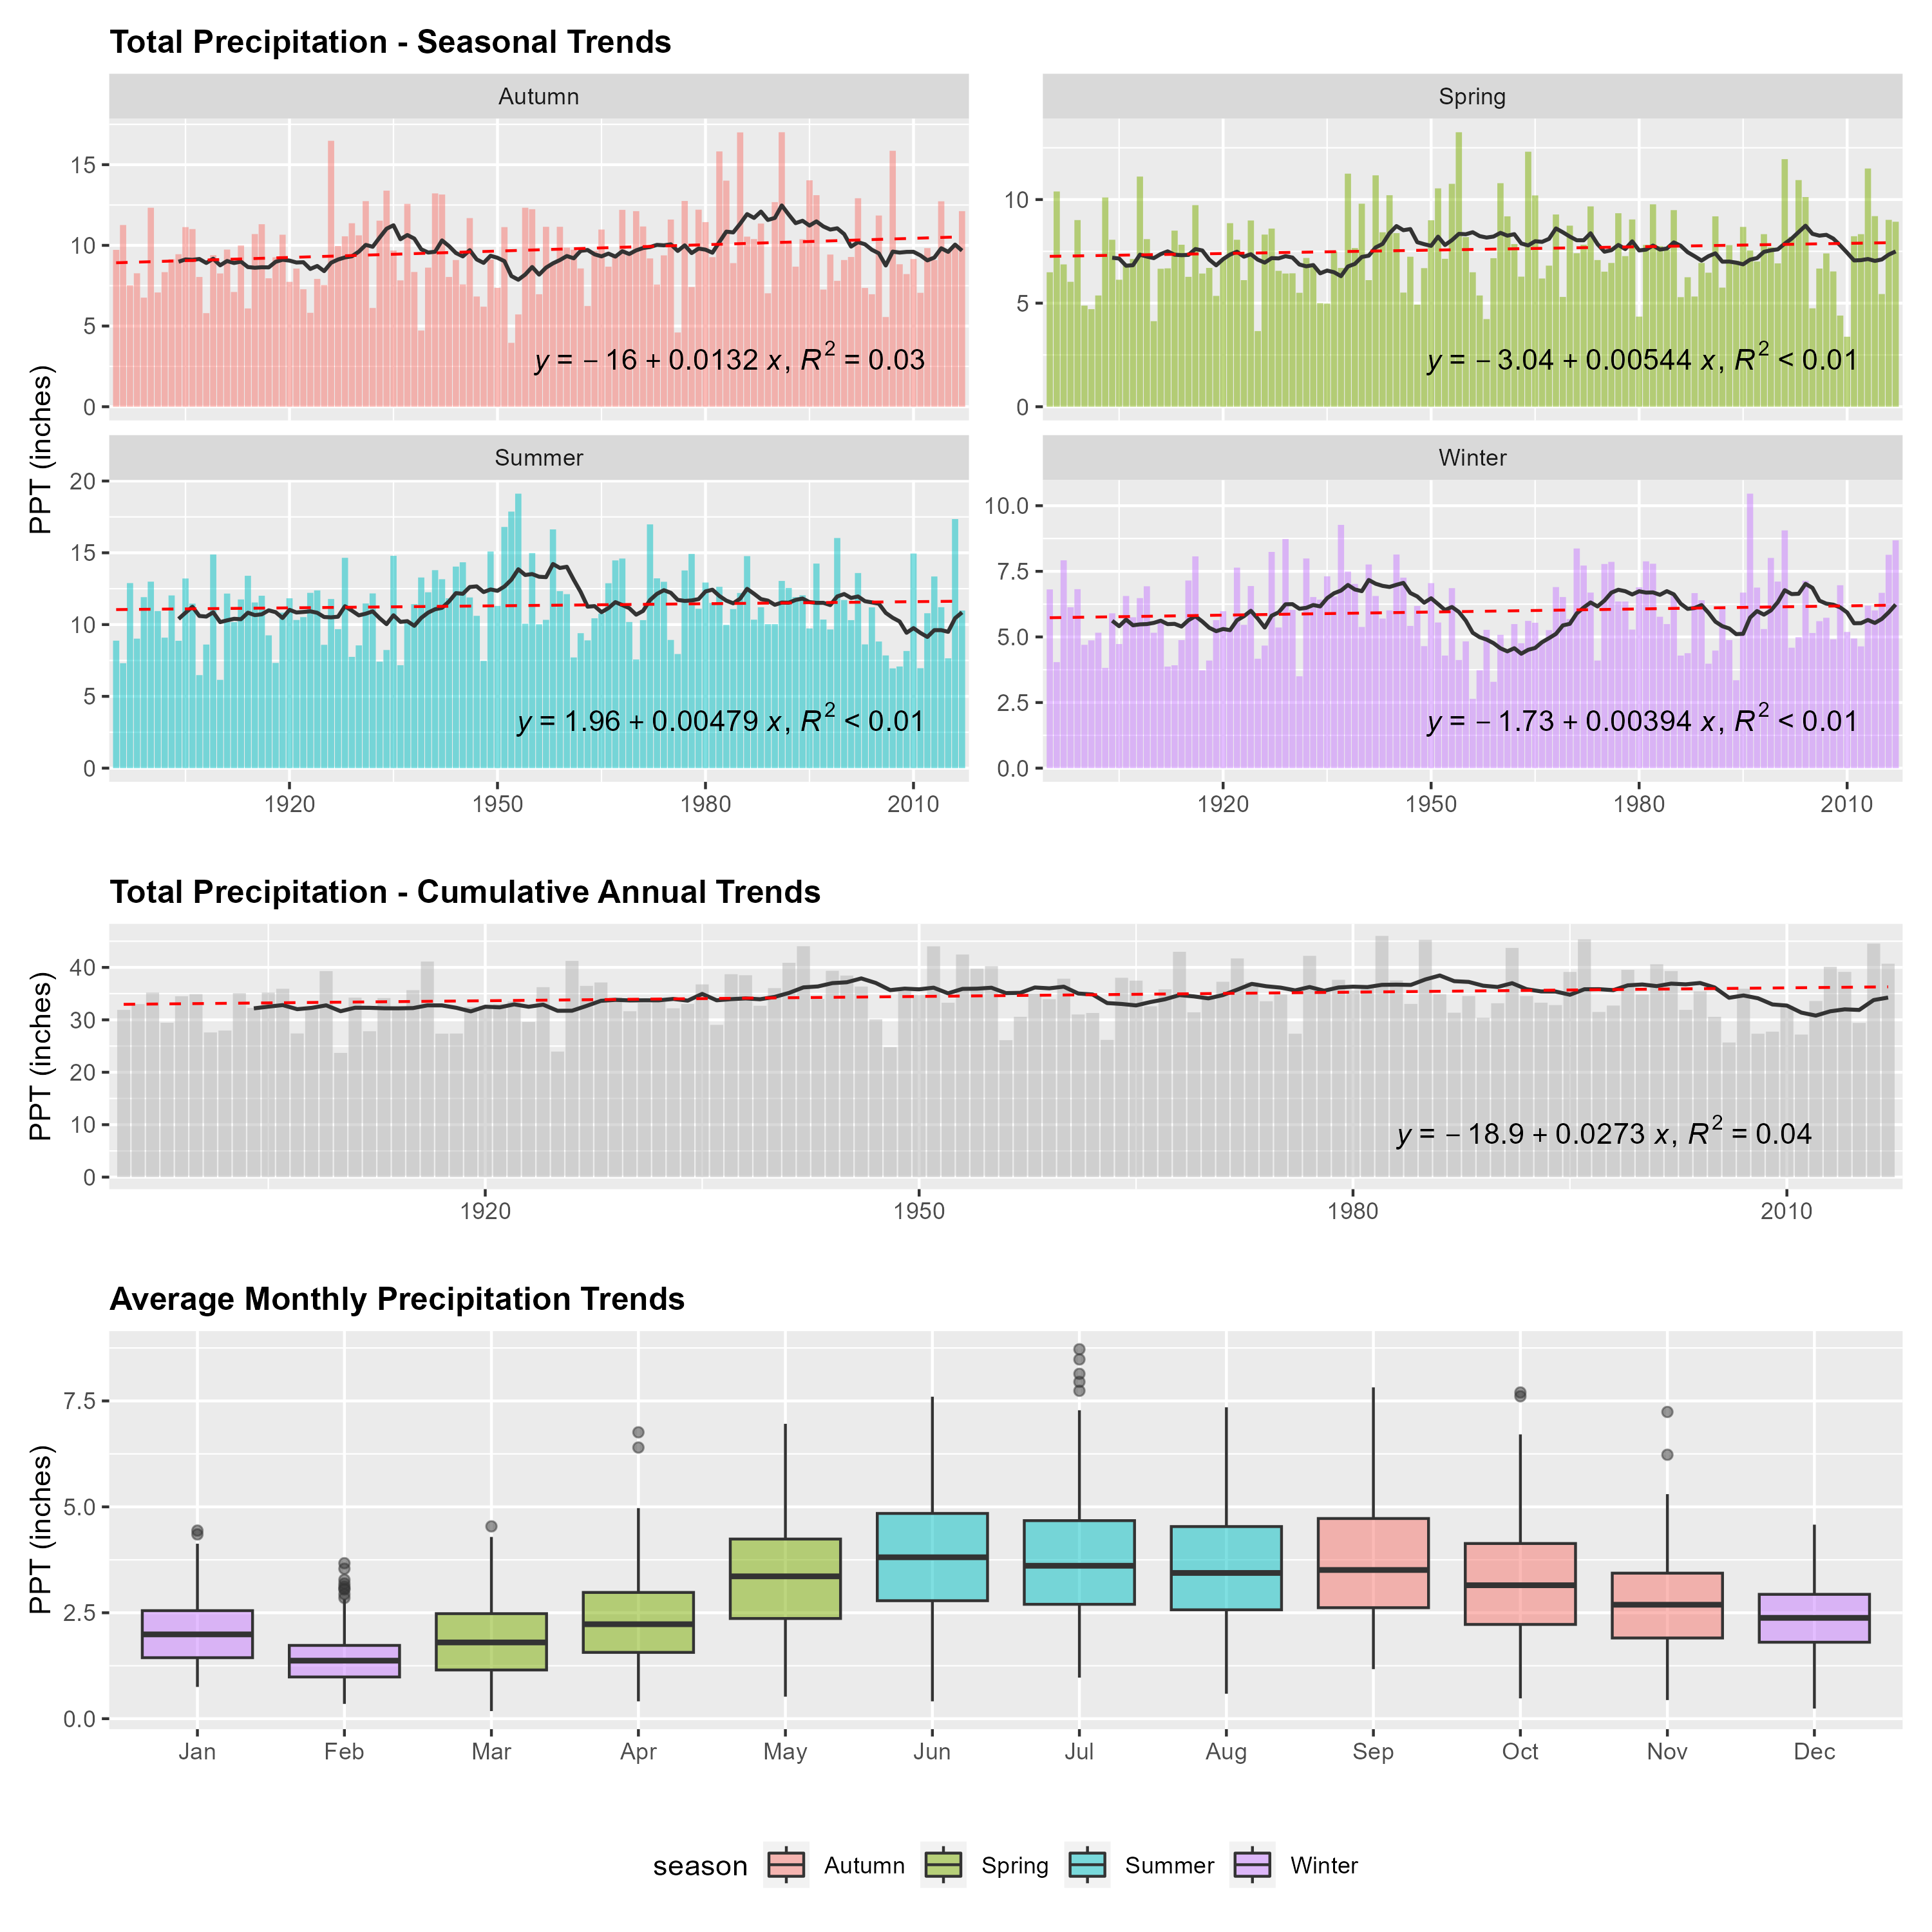
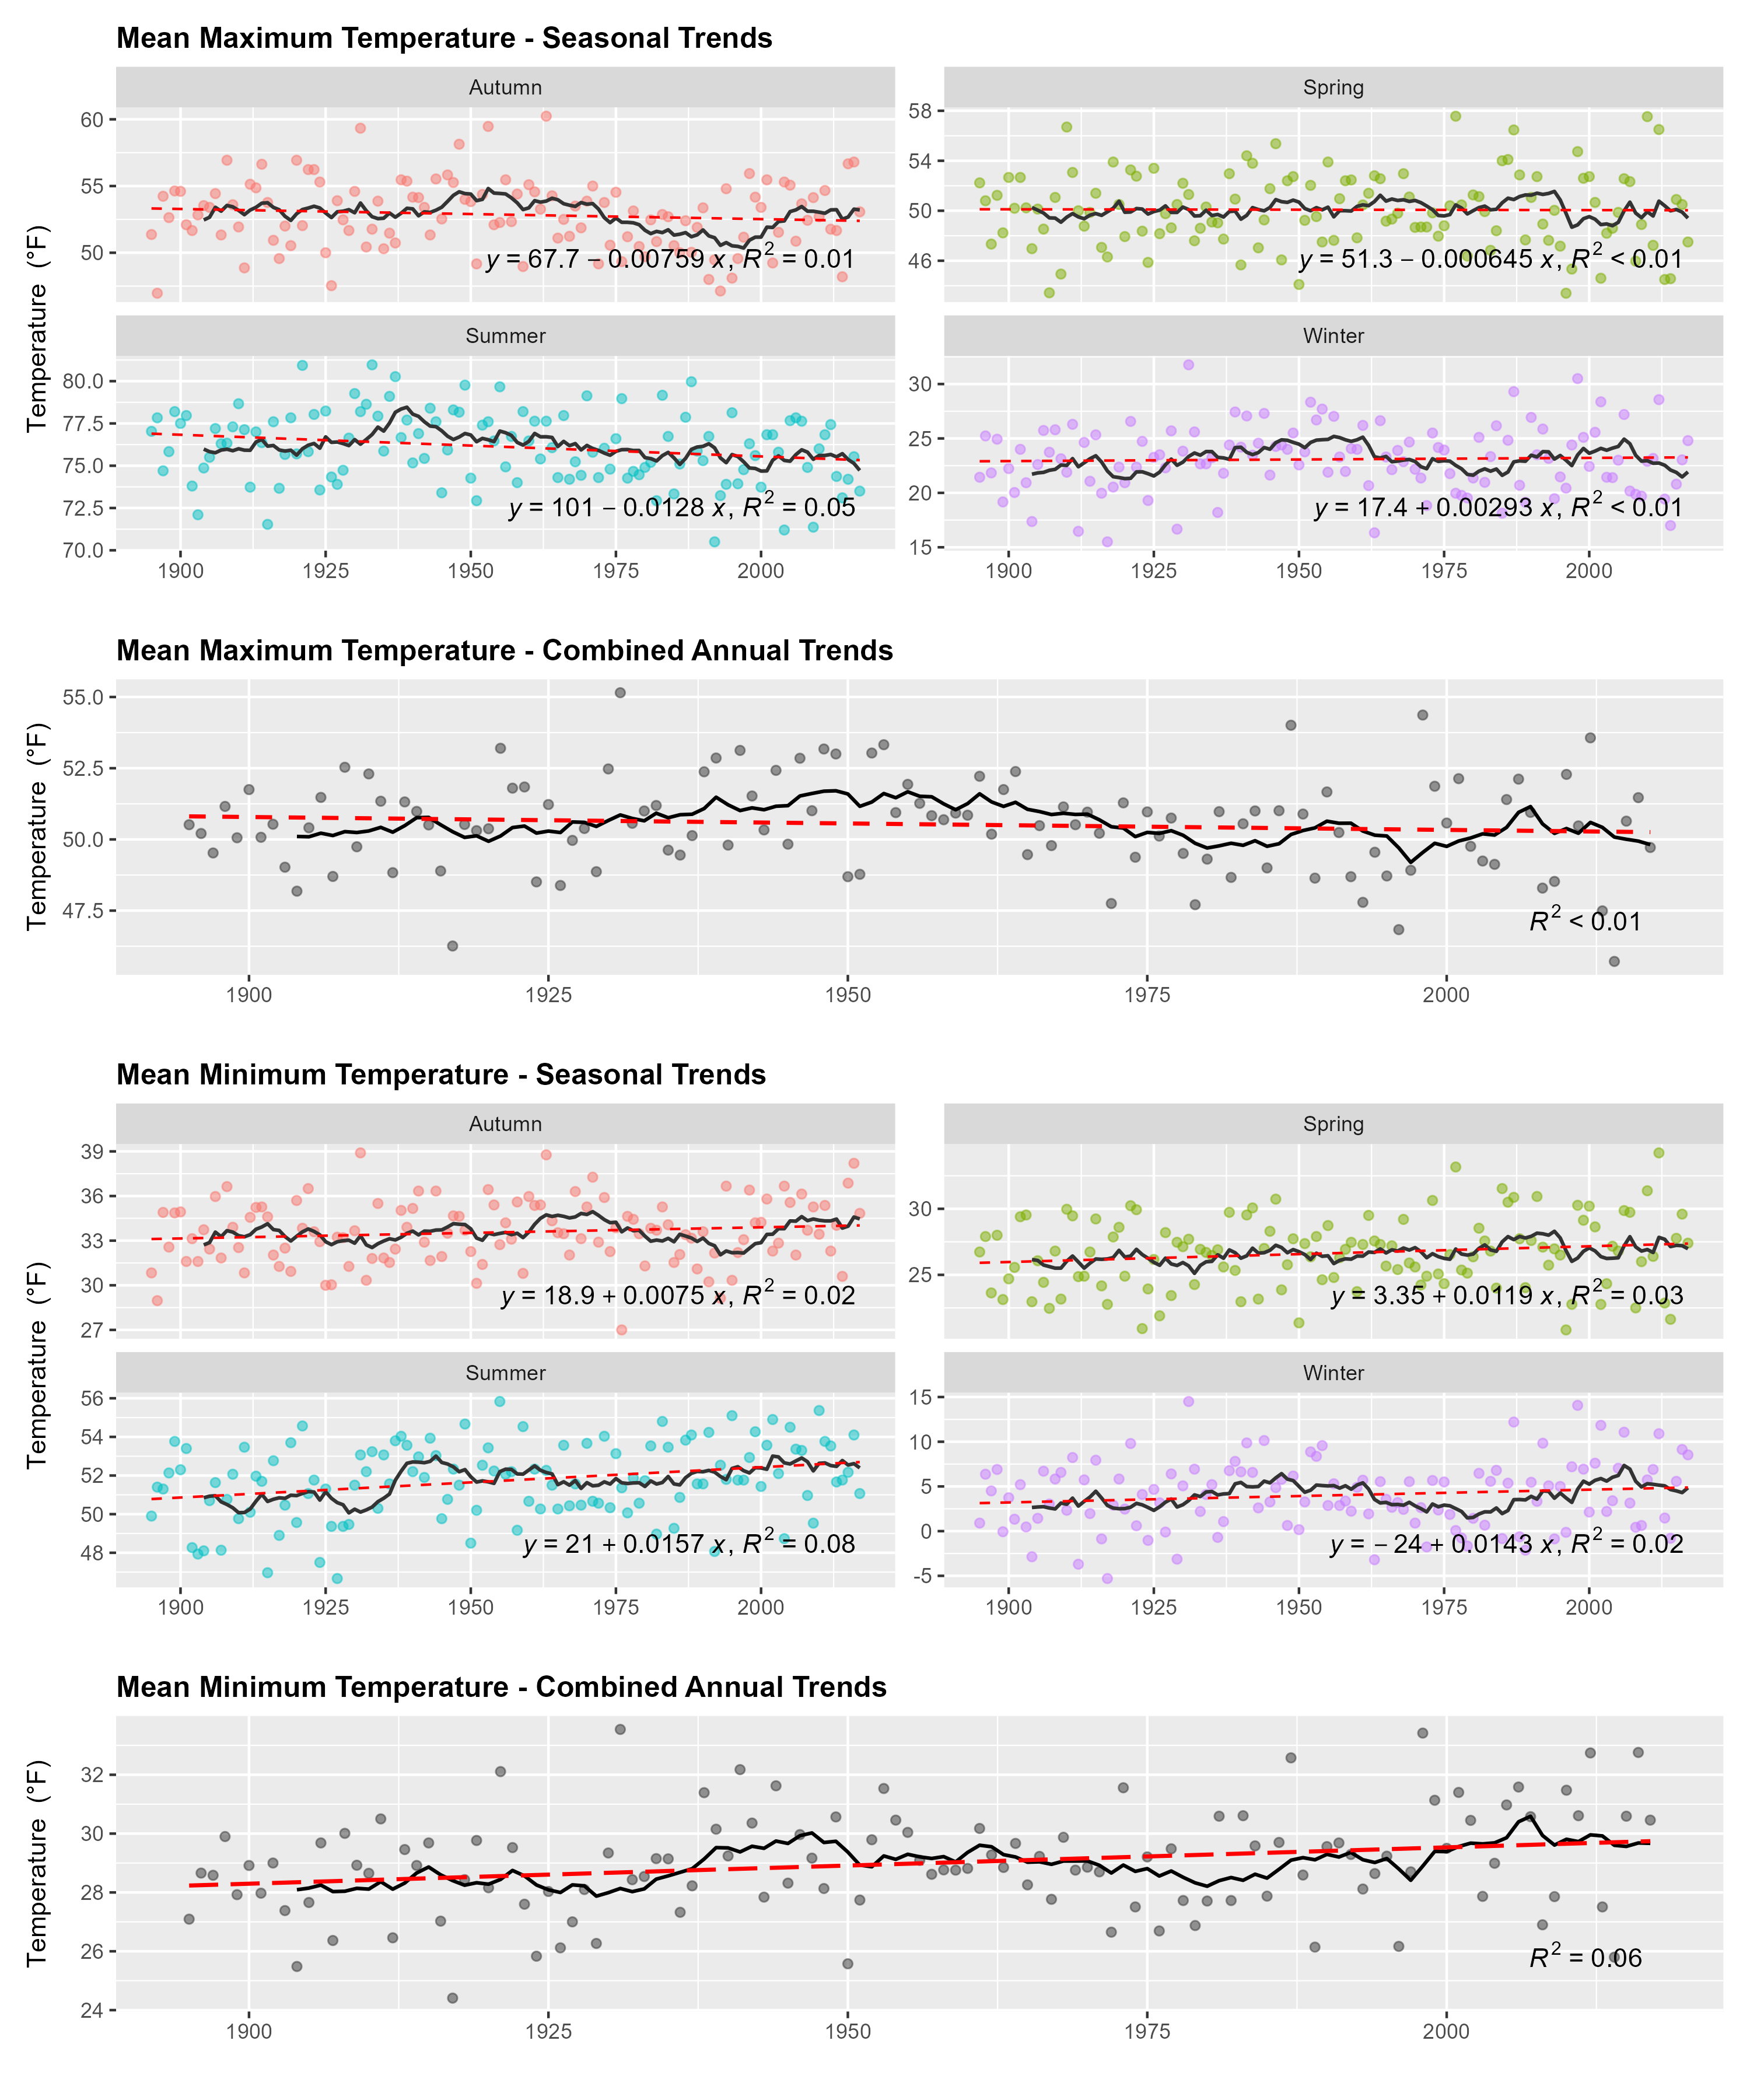
Here are the resulting figures showing trends in precipitation and temperature for the Upper Peninsula of Michigan over the last ~100 years.

