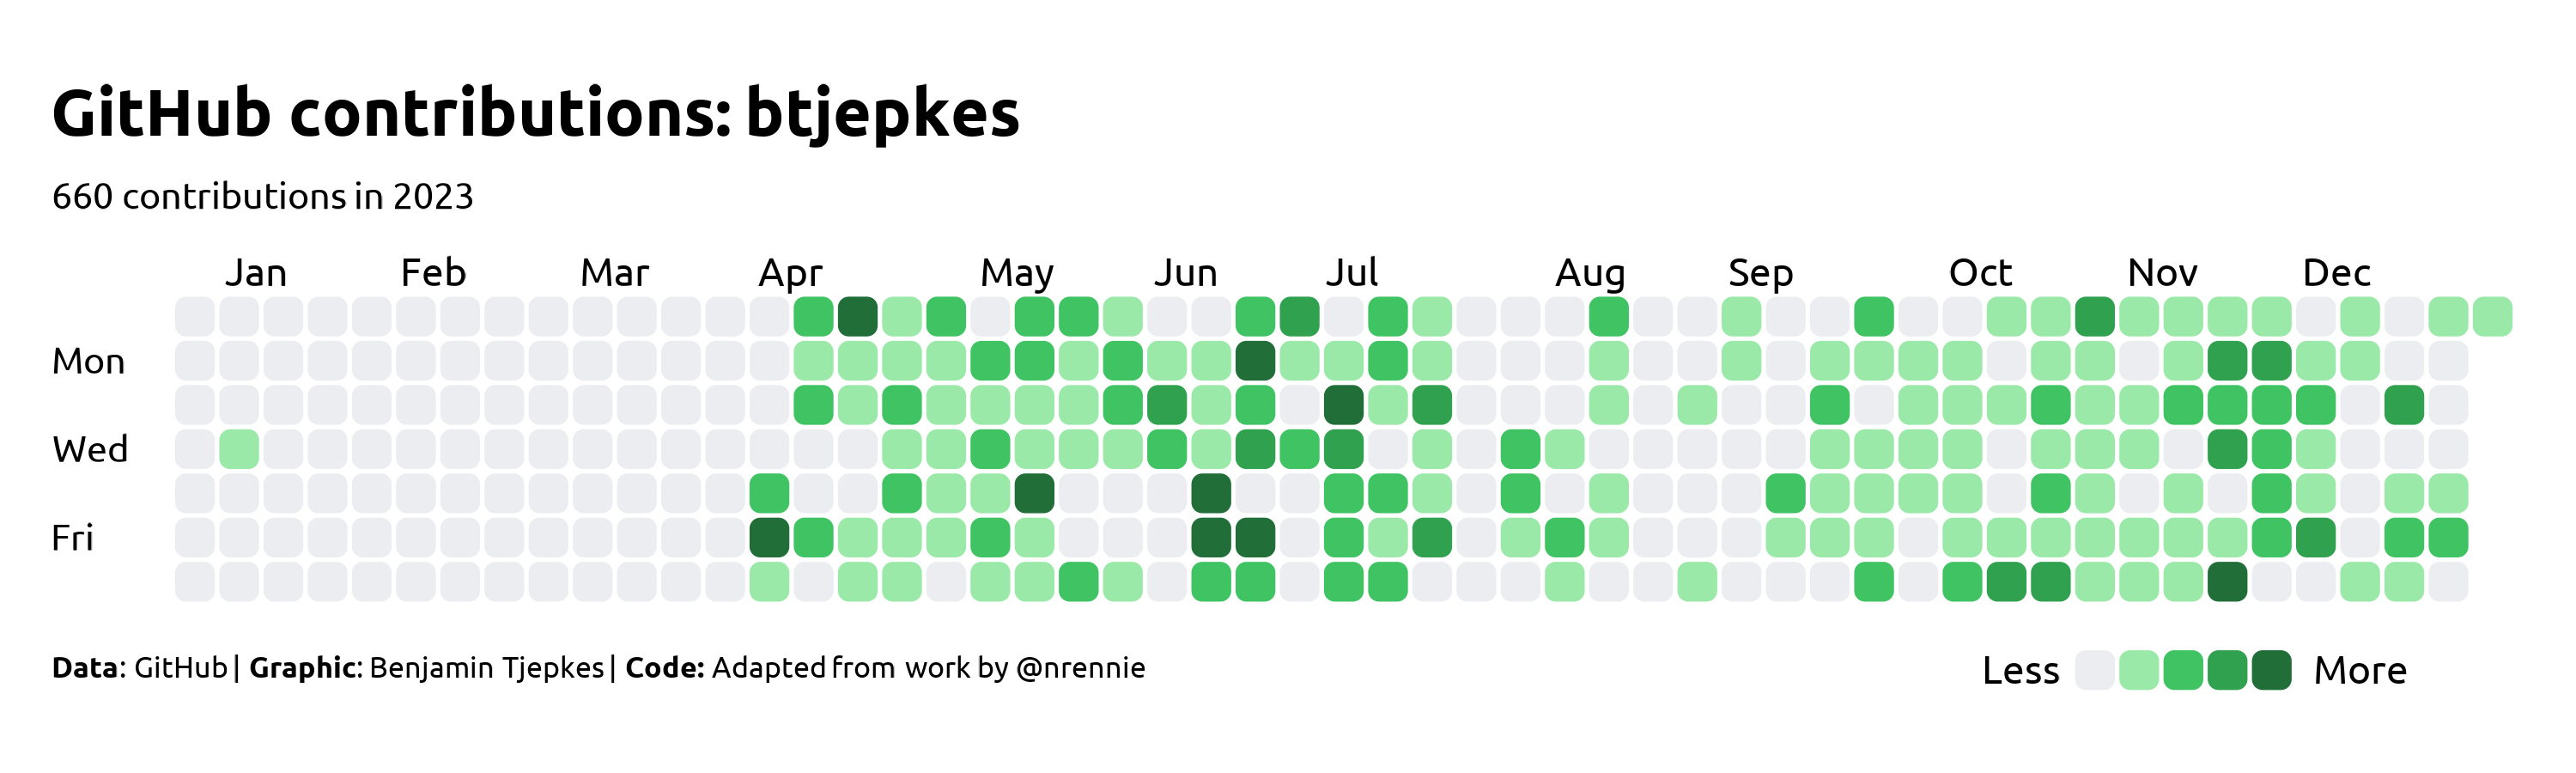
This figure, inspired by the work of @nrennie, was created for Week 1 of the 2024 TidyTuesday. Data were downloaded from GitHub using the gh package in R. Figure production was completed in RStudio with several packages, including ggplot, tidyverse, and showtext. My entire workflow can be found on my project GH repo. The resulting figure summarizes my 660 commits in 2023 using a styled visualization replicated from the GitHub activity tracker.