Objectives
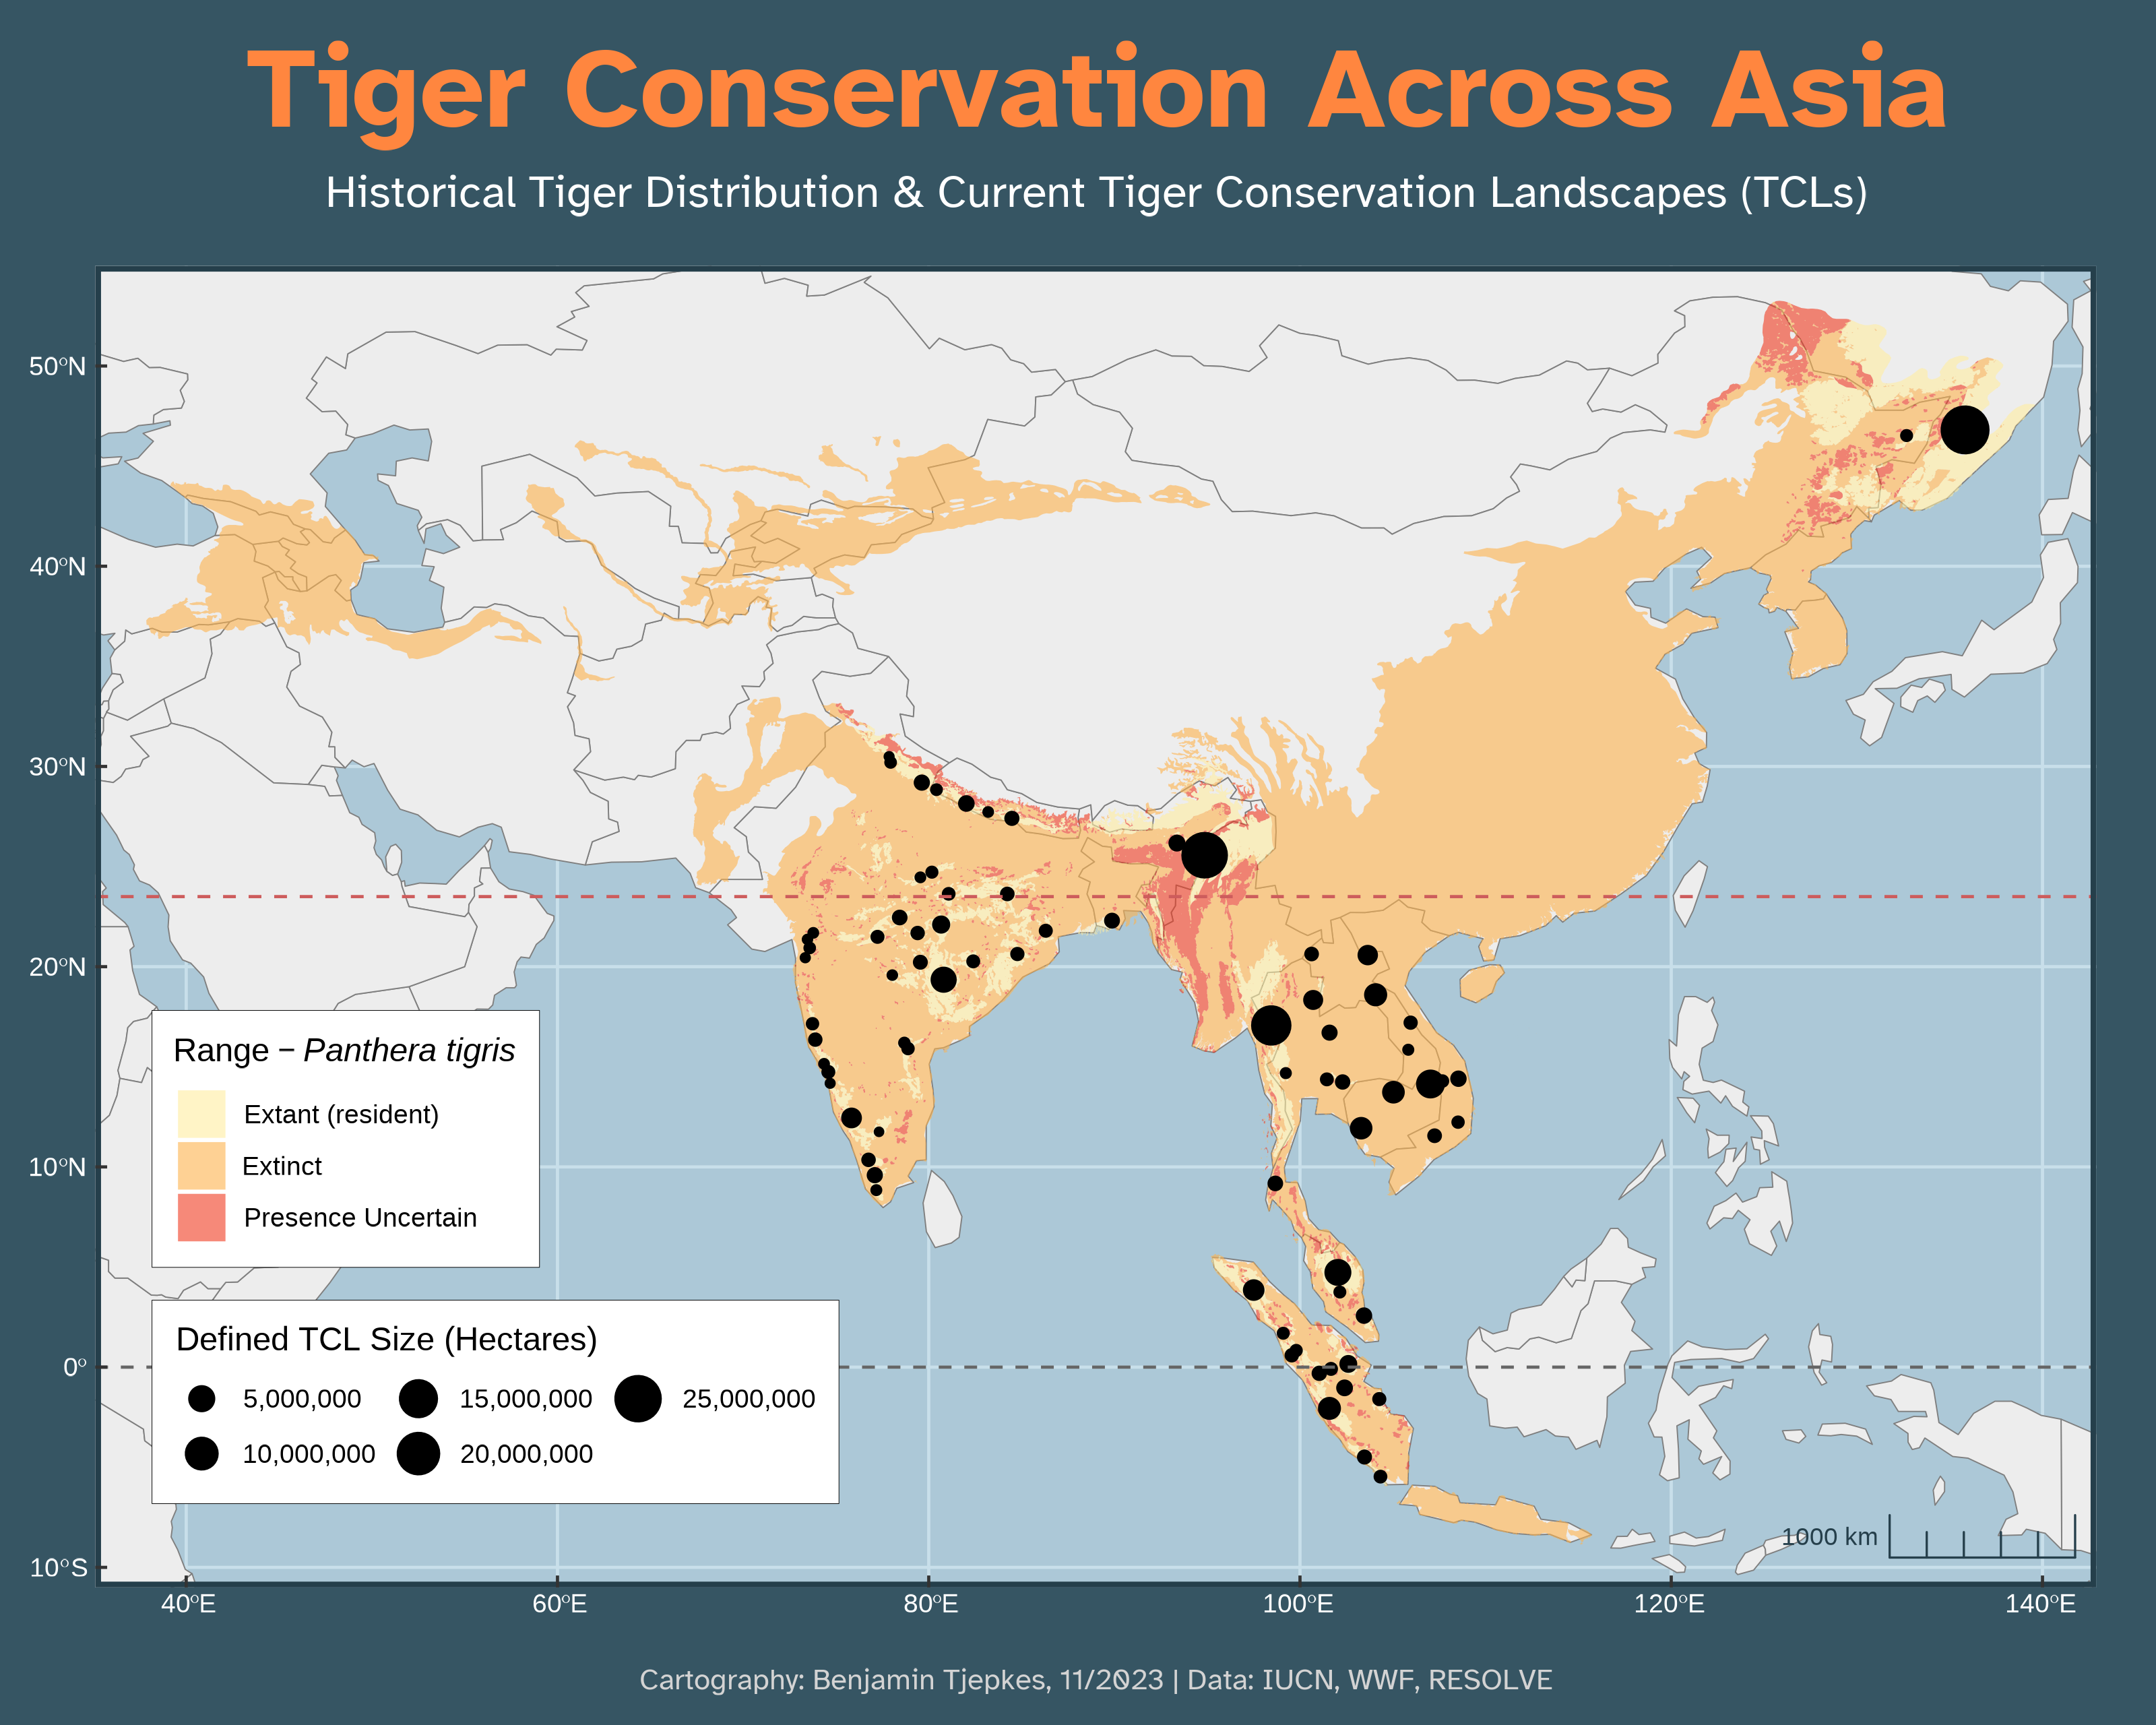
This map was my contribution to Day Six of the 2023 30 Day Map Challenge, which prompted “Asia” as the main subject. I knew right away that I was going to be mapping either a threatened wildlife species or a threatened orchid species given this location. I was also wanting an interesting project to work more creatively in RStudio on my programmatic cartography and this fit the bill perfectly. The resulting map shows the three classes of distribution and proportional symbols indicating the current TCL sizes across Asia.
Tools & Workflow
Like many of my visualizations in R, I assembled this map using ggplot and many ancillary packages. One package that I was happy to use was arcgisbinding, which allowed me to easily load in a web feature layer (Tiger Conservation Landscapes from the Esri Living Atlas).
library(rnaturalearth)
library(sf)
library(tidyverse)
library(ggspatial)
library(ggtext)
library(showtext)
library(camcorder)
library(arcgisbinding)
The historical and current range data were available as a download from the IUCN Red List. These overlapped well with the TCLs, so I decided to handle those as proportional symbols based on their area.