Overview
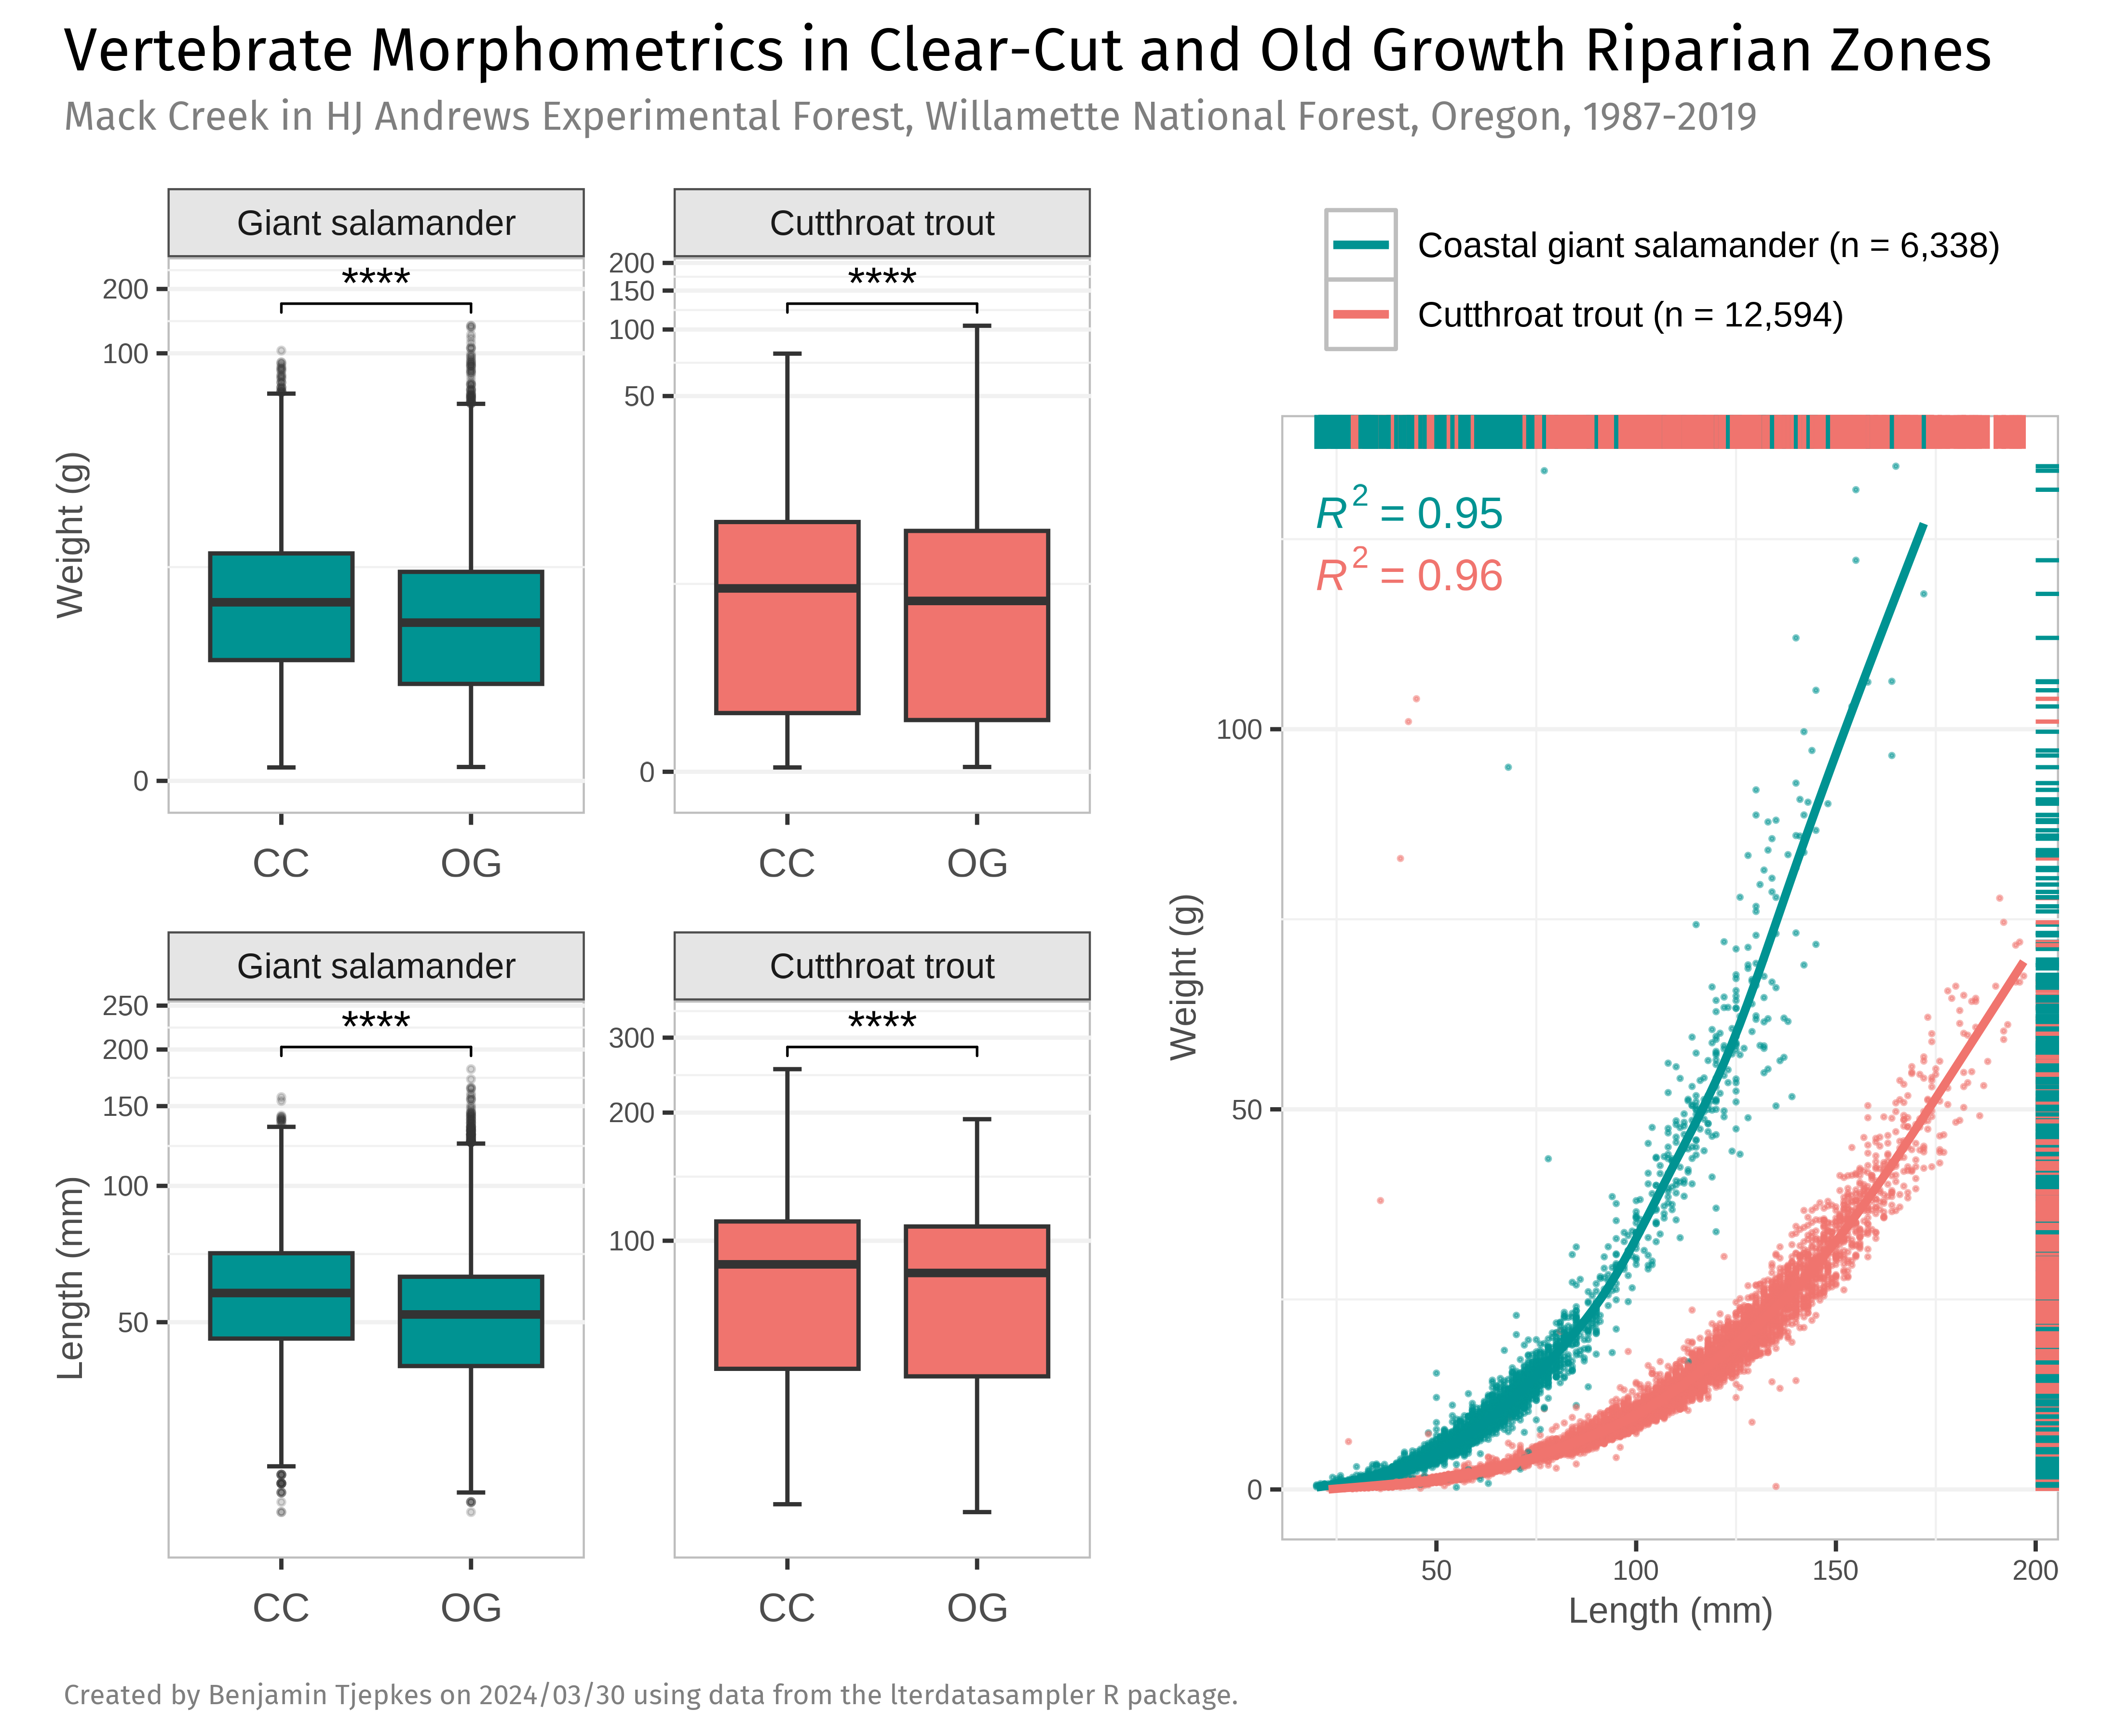
This figure was developed for the coding example portion of a job interview. The resulting figure of 2-3 different chart types is shown here, including boxplots, scatterplot, and rug plots. The data used in this visualization came directly from lterdatasampler, which is a really neat R package providing practice datasets from long-term ecological research sites across the United States.